TL;DR: Median single-family prices across the main Grand Strand areas ranged from about $378,000 to $730,000 in August 2026, and days on market ranged from 93 to 124. Compare areas by price, time on market, inventory, and buyer activity first. Then check the costs the data can't show, such as HOA dues, insurance, and flood zones.
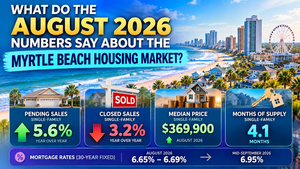
Myrtle Beach neighborhoods can look alike from a distance, but the numbers tell a more specific story. According to CCAR MLS (September 2026), the region's median single-family price was $370,000, and homes took 118 days to sell. Those regional figures hide wide gaps. In August 2026, the median single-family price in Little River was $377,500, while Pawleys Island–Litchfield reached $730,495. Time on market and buyer activity varied too. This guide shows how to compare areas across Horry County and the wider Grand Strand using local MLS data, so your shortlist rests on facts. Current data shows the gap between areas is larger than many buyers expect.
Myrtle Beach Neighborhoods Compared by Price and Inventory
CCAR MLS reports activity by area, not by individual subdivision. Those area boundaries don't always match city limits. The Myrtle Beach area in this report covers ZIP codes 29572 and 29577. North Myrtle Beach, Surfside Beach, and unincorporated Horry County each follow their own local rules, so the labels below describe MLS areas only.
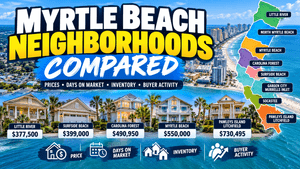
Single-family homes by area, August 2026
| Area | Median Price | Days on Market | Homes for Sale |
|---|---|---|---|
| Little River | $377,500 | 107 | 216 |
| Socastee | $379,900 | 124 | 297 |
| Surfside Beach | $399,000 | 113 | 288 |
| Garden City / Murrells Inlet | $487,500 | 104 | 305 |
| Carolina Forest | $490,950 | 93 | 284 |
| Myrtle Beach | $550,000 | 98 | 322 |
| North Myrtle Beach | $583,078 | 112 | 289 |
| Pawleys Island / Litchfield | $730,495 | 106 | 121 |
Prices in this group span about $353,000. Little River, Socastee, and Surfside Beach sit under $400,000. Garden City–Murrells Inlet and Carolina Forest cluster near $490,000. Myrtle Beach and North Myrtle Beach land between $550,000 and $583,000.
Inventory differs as well. Pawleys Island–Litchfield had 121 homes for sale, while Myrtle Beach had 322. These medians also run above the regional figure because the regional total includes inland areas such as Conway ($314,020) and Loris–Longs ($320,000), according to the same August 2026 report.
Read the table as a starting point. A median describes the middle sale, not every home, so a single area includes entry-level, mid-range, and higher-priced homes. Compare each median with the number of homes for sale to see how much choice you'll have in that area.
How Days on Market Differ Across the Grand Strand
Time on market gives a second view of each area. According to CCAR MLS (August 2026), Carolina Forest recorded the shortest time at 93 days, followed by Myrtle Beach at 98 and Garden City–Murrells Inlet at 104. Socastee recorded the longest in this group at 124 days.
The spread is real, but it's narrower than the price spread. Every area in the table sat above 90 days. Here's how that compares with the wider picture:
Regional single-family: 118 days in September 2026.
Regional condos and townhomes: 137 days in September 2026.
Sale-to-list ratio: Single-family sellers received 97.3% of list price, and condo sellers received 95.9%.
Price band matters about as much as location. CCAR MLS (September 2026) shows that over the past 12 months, homes priced $150,001–$250,000 took 121 days to sell. Homes priced at $1 million or more took 129 days.
Supply varies by property type, too. CCAR MLS (September 2026) reports 4.2 months of supply for single-family homes and 7.5 months for condos across the region. A neighborhood with mostly condos will behave differently from one with mostly detached homes.
Use these figures to set expectations, not to predict a single result. A home priced well for its area can still take longer than the area figure suggests, especially when it sits in a different price band.
What Buyer Interest Says About Each Area
Showings add context to price and time on market. CCAR MLS tracks total showings and showings per listing, which gauges how many buyers tour each active home. According to CCAR MLS Showings Report (September 2026), buyer interest by area looked like this:
Pawleys Island: 2.9 showings per listing
Surfside Beach: 2.4
Little River and Murrells Inlet: 2.3 each
North Myrtle Beach: 2.1
Garden City Beach: 1.9
Myrtle Beach: 1.8
Pawleys Island pairs the highest interest with the smallest inventory in the August table. Myrtle Beach logged the most showings overall at 5,761, spread across a larger supply of listings.
Year-over-year changes vary widely. Total showings in Myrtle Beach fell 15.6% from September 2025, and Murrells Inlet fell 33.7%. Garden City Beach rose 10.2%, while Pawleys Island was nearly flat at -0.3%.
Higher interest per listing means more buyers are touring the same homes. Lower interest per listing means buyers have more homes to choose from. Neither reading makes an area better. Each one describes how busy showing activity is.
Treat these figures with care. Showings are not sales, and the report doesn't break out Carolina Forest or Socastee on their own. Use buyer interest as one signal alongside price and days on market.
How Mortgage Rates Affect Your Neighborhood Comparison
Rates change what a given price means each month. According to FRED (September 2026), the 30-year fixed mortgage rate averaged 6.95% for the week of September 17. That was up from 6.76% on September 10. Weekly readings in August averaged 6.67%. Check the latest reading before you compare, since weekly figures move.
CCAR MLS (September 2026) also notes that the Federal Reserve raised its rate by a quarter point on September 16, to a range of 3.75% to 4%. FRED shows the effective federal funds rate at 3.63% in August 2026.
A higher rate raises the monthly payment at every price point. That means the same budget stretches differently across the table above. A home near $380,000 in Little River and one near $550,000 in Myrtle Beach carry different payments, and the gap shifts with the rate.
Here's a practical way to use rate data. Pick a monthly payment you're comfortable with, confirm today's rate with a lender, and then compare areas at that payment instead of at the sticker price. Property taxes, HOA dues, and insurance add to the monthly figure, and they differ by area and by home.
These figures are as of September 2026. Programs and rates are subject to change; verify current details with a lender.
What the Numbers Don't Show About Any Area
MLS statistics don't capture every cost or rule that shapes a purchase in Horry County. Before you settle on an area, gather this information for each address you're considering. Ask for these details early, since they can change a monthly budget more than a small difference in list price.
HOA dues and rules: Fees and restrictions vary by community, even within one MLS area.
Flood zone and elevation: Check the FEMA flood designation for the specific lot.
Insurance quotes: Request homeowners, wind, and flood quotes before you make an offer.
Local jurisdiction: The City of Myrtle Beach, North Myrtle Beach, Surfside Beach, and unincorporated Horry County each have their own permitting and fee structures.
Lot and build conditions: Lot size, setbacks, and site conditions affect what you can build or add.
For a city-by-city look at pricing, see our Myrtle Beach market by city breakdown. Consult with a licensed professional for your specific situation.
Once you've narrowed your list to two or three areas, the next question is often what building on a lot there involves, from flood zone requirements to permitting and site conditions. Carolina Crafted Homes can walk through those questions for Horry County locations and explain how a custom build would work on your shortlisted lots. If you'd like to talk through your options, get in touch.
FAQ SECTION
What are the main neighborhoods in Myrtle Beach?
CCAR MLS groups the market by area rather than by subdivision. In its August 2026 Local Market Update, the areas include Myrtle Beach, North Myrtle Beach, Carolina Forest, Surfside Beach, Socastee, Little River, Garden City–Murrells Inlet, and Pawleys Island–Litchfield. Each area contains many individual communities with different HOA rules, home ages, and lot sizes. These MLS areas also don't always match city limits, so confirm the jurisdiction of any address with the county or municipality.
How much do homes cost in different parts of Myrtle Beach?
According to CCAR MLS (August 2026), median single-family prices ranged from $377,500 in Little River to $730,495 in Pawleys Island–Litchfield. Myrtle Beach came in at $550,000, North Myrtle Beach at $583,078, and Carolina Forest at $490,950. Across the region, CCAR MLS (September 2026) reports a single-family median of $370,000 and a condo median of $230,125. A median describes the middle sale, so individual homes in each area sell above and below these figures.
Which Myrtle Beach area has homes selling fastest?
Among the areas CCAR MLS reported in August 2026, Carolina Forest had the shortest time on market at 93 days, followed by Myrtle Beach at 98 days. Socastee had the longest at 124 days. Regionally, single-family homes took 118 days in September 2026. Price band also matters. CCAR MLS (September 2026) shows homes priced $150,001–$250,000 took 121 days over the past 12 months, while homes at $1 million or more took 129 days.
How competitive is the Myrtle Beach housing market right now?
Competition differs by property type and area. CCAR MLS (September 2026) reports 4.2 months of supply for single-family homes and 7.5 months for condos, with sellers receiving 97.3% and 95.9% of list price, respectively. Showings per listing ranged from 1.8 in Myrtle Beach to 2.9 in Pawleys Island. Those readings describe conditions as of September 2026 and can change. A local professional can help you interpret them for your price range.
How do mortgage rates change what I can afford in Myrtle Beach?
Rates change the monthly payment at every price point. According to FRED (September 2026), the 30-year fixed mortgage rate was 6.95% for the week of September 17, up from 6.76% the week before. Property taxes, HOA dues, and insurance add to the payment, and they vary by area and by home. A lender can run payments at current rates for specific homes. Programs and rates are subject to change; verify current details.
What should I check besides price when comparing Myrtle Beach neighborhoods?
Start with HOA dues and rules, the FEMA flood zone for the specific lot, and insurance quotes for homeowners, wind, and flood coverage. Then confirm which jurisdiction the address falls in, since the City of Myrtle Beach, North Myrtle Beach, Surfside Beach, and unincorporated Horry County each have different permitting and fee structures. If you plan to build, ask about setbacks and site conditions too. Consult with a licensed professional for your specific situation.
Sources