TL;DR: In August 2026, more buyers across the Grand Strand went under contract on single-family homes, while fewer deals closed. The median single-family price rose to $369,900 and supply tightened to 4.1 months. Those August contracts were signed when rates were around 6.65% to 6.69%. By mid-September, rates had climbed to 6.95%.
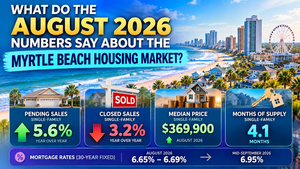
The August numbers for the Myrtle Beach housing market point in two directions. Buyer activity picked up, but closings slipped. According to CCAR MLS (August 2026), single-family pending sales rose 5.6% year over year, and closed sales fell 3.2%.
That gap tells you a lot about where the market sits heading into fall. Contract activity shows what buyers are doing now. Closings mostly reflect decisions made earlier in the summer.
This report walks through the key single-family and condo figures. It also adds rate context from FRED, since August buyers locked in their terms before September's jump.
Myrtle Beach Housing Market August 2026: The Headline Numbers
Here is what changed for single-family homes across the CCAR region, which covers Horry County and nearby coastal markets.
Single-Family Market Snapshot: August 2025 vs. August 2026
| Metric | August 2025 | August 2026 | Change |
|---|---|---|---|
| Pending Sales | 986 | 1,041 | +5.6% |
| Closed Sales | 1,008 | 976 | -3.2% |
| Median Sales Price | $362,868 | $369,900 | +1.9% |
| Days on Market | 117 | 113 | -3.4% |
| Percent of List Price Received | 97.2% | 97.6% | +0.4% |
| Inventory of Homes for Sale | 3,943 | 3,815 | -3.2% |
| Months Supply of Inventory | 4.3 | 4.1 | -4.7% |
Source: CCAR MLS Monthly Indicators (August 2026), current as of September 10, 2026.
A few points stand out:
Prices rose modestly. The August median climbed 1.9%, though the year-to-date median of $361,000 sits 1.1% below 2025's pace.
Sellers kept more of their asking price. Homes sold for 97.6% of list price on average, up from 97.2%.
Supply tightened. Inventory fell 3.2%, and new listings dipped 1.0% to 1,244.
At 4.1 months of supply, the single-family market remains more balanced than it was in the low-inventory years. It is still tighter than it was this time last year.
Why Pending Sales Rose While Closings Fell
The split between pendings and closings looks odd at first. It makes more sense once you consider timing.
A pending sale counts when a buyer and seller sign a contract. The closing happens weeks later. So each month's closed sales largely reflect contracts written in earlier months.
CCAR MLS (August 2026) shows single-family pending sales dipped 1.9% in June and 3.9% in July. That softer summer contract activity lines up with August's 3.2% drop in closings.
August then reversed the trend. Pendings reached 1,041, the strongest August result in the three years CCAR tracks in this report.
Year to date, the two measures are moving together. Through August 2026:
Pending sales totaled 7,942, up 0.9%
Closed sales totaled 7,441, also up 0.9%
In other words, the month-to-month swings even out over a longer view. The Grand Strand is not seeing a surge or a slump. It is seeing steady, slightly higher volume than 2025.
Local showing activity supports that picture. The CCAR Showings Report (August 2026) logged 7,045 showings in the Myrtle Beach MLS area, the highest count of any area in the region.
Not every pending contract reaches the closing table. The September and October reports will show how much of August's contract activity converts to completed sales.
For the longer trend behind these numbers, see our Myrtle Beach mid-year housing market report.
Mortgage Rates: August Contracts vs. September Conditions
Rate timing matters for reading the August data. According to FRED's 30-year fixed mortgage series (September 2026), weekly averages stayed in a narrow band all month.
30-Year Fixed Mortgage Rate, Weekly Averages
| Week Of | Average Rate |
|---|---|
| August 6, 2026 | 6.69% |
| August 13, 2026 | 6.67% |
| August 20, 2026 | 6.65% |
| August 27, 2026 | 6.66% |
| September 3, 2026 | 6.71% |
| September 10, 2026 | 6.76% |
| September 17, 2026 | 6.95% |
Source: FRED, 30-Year Fixed Rate Mortgage Average (MORTGAGE30US), as of September 17, 2026.
August buyers signed contracts with rates between 6.65% and 6.69%. That is slightly higher than August 2025, when weekly averages ran from 6.56% to 6.63%. Contract activity still rose.
September brought a sharper move. The weekly average reached 6.95% on September 17, 2026.
To put that in payment terms, here is a simple illustration. On a $369,900 home with 10% down, principal and interest would run about $2,142 per month at 6.67%. At 6.95%, the same loan runs about $2,204. That is roughly $62 more each month.
This example excludes taxes, insurance, and fees, and your rate will depend on your loan and credit profile. Rates are subject to change; verify current details with your lender.
CCAR's Housing Affordability Index for single-family homes also slipped to 79 in August, down 2.5% from a year earlier.
What the Condo Numbers Add
Condos followed the same pattern with bigger swings. According to CCAR MLS (August 2026):
Condo pending sales jumped 13.2% to 471
Condo closed sales fell 7.9% to 408
The median condo price held flat at $230,000
Days on market dropped 14.7% to 116
Supply looks very different from single-family homes. Condos sit at 7.6 months of supply, compared with 4.1 months for single-family homes. Inventory ticked up 0.6% to 3,284 units.
That gap matters when you compare options along the Grand Strand. Condo buyers currently have more listings to choose from and more room for negotiation. Single-family buyers face tighter supply and firmer pricing, with sellers receiving 97.6% of list price versus 96.3% for condos.
We covered how these supply differences affect negotiating power in our buyer leverage report.
What This Means If You're Weighing a Move
Current data shows a steady market, not a dramatic one. Prices are close to flat for the year. Volume is up slightly. Supply is tighter for single-family homes and roomier for condos.
The bigger variable right now is financing. Buyers shopping in September face higher rates than August buyers did. That shifts monthly budgets even when prices stay put.
If you are thinking about building rather than buying resale, the same numbers apply. Tight single-family supply and a $369,900 median set the baseline many buyers use to compare a custom home against existing inventory in Horry County.
Every situation is different, so consult with a licensed professional for your specific plans.
Whether you're comparing resale inventory to a custom build or sorting out how September's rate move affects your budget, the August numbers are a useful starting point. We're happy to walk through what 4.1 months of supply and a $369,900 median mean for the home you have in mind, including lot, size, and timing questions. When you're ready, start the conversation with our team.
FAQ
What is the median home price in Myrtle Beach in August 2026?
According to CCAR MLS (August 2026), the median single-family sales price across the region was $369,900, up 1.9% from $362,868 in August 2025. The year-to-date single-family median is $361,000, which is 1.1% below 2025's pace. Condos had a median price of $230,000, unchanged from a year earlier. These figures cover the full CCAR region, so prices in specific Grand Strand communities can run higher or lower depending on location, size, and proximity to the beach.
Is the Myrtle Beach housing market slowing down?
Current data doesn't show a clear slowdown. CCAR MLS (August 2026) reports single-family pending sales up 5.6% year over year, while closed sales dipped 3.2%. Year to date, both pending and closed single-family sales are up 0.9%. That points to steady activity with normal month-to-month swings. The closing dip in August lines up with softer contract activity in June and July, which is typical of the lag between signing a contract and closing.
Why did pending sales go up while closed sales went down?
Pending sales count contracts signed during the month. Closed sales count deals that finished, and most of those contracts were signed weeks earlier. According to CCAR MLS (August 2026), single-family pending sales fell 1.9% in June and 3.9% in July. That softer summer contract activity helps explain August's lower closing count. August's rise in pendings reflects new buyer activity, though not every contract reaches the closing table.
How much inventory is there in the Grand Strand right now?
CCAR MLS (August 2026) reports 3,815 single-family homes for sale, down 3.2% from a year earlier. That equals 4.1 months of supply. Condo inventory reached 3,284 units, up 0.6%, for 7.6 months of supply. Single-family buyers currently have fewer options than condo buyers, which helps explain why single-family homes sold closer to list price (97.6%) than condos (96.3%).
What were mortgage rates in August 2026?
According to FRED's 30-year fixed mortgage series, weekly averages ranged from 6.65% to 6.69% during August 2026. Rates then rose through September, reaching 6.95% for the week of September 17, 2026. These are national averages, and your actual rate will depend on your loan type, down payment, and credit profile. Rates are subject to change, so verify current details with a lender before making decisions.
How long does it take to sell a home in Myrtle Beach?
According to CCAR MLS (August 2026), single-family homes averaged 113 days on market until sale, down 3.4% from 117 days a year earlier. Condos averaged 116 days, down 14.7%. These figures measure the full time from listing to sale. Pricing, condition, and location all affect how quickly an individual home sells, so local results can vary widely across Horry County.
Sources
CCAR MLS Monthly Indicators & Showings Report (August 2026): https://www.ccarsc.org/pages/marketstats/
FRED — 30-Year Fixed Rate Mortgage Average (MORTGAGE30US): https://fred.stlouisfed.org/series/MORTGAGE30US
Myrtle Beach Housing Market Mid-Year Report 2026: https://www.carolinacraftedhomes.com/blog/myrtle-beach-housing-market-mid-year-report-2026
Buyer Leverage in the Myrtle Beach Housing Market: https://www.carolinacraftedhomes.com/blog/myrtle-beach-housing-market-buyer-leverage-2026
More Market Trends Reports: https://www.carolinacraftedhomes.com/blog/category/Market+Trends