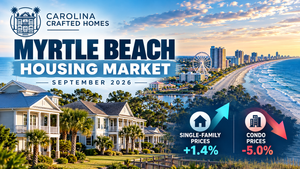
TL;DR: Across the Grand Strand, the single-family median price rose 1.4% to $370,000 in September 2026, even as fewer homes were listed, went under contract, and closed. Condo prices slipped 5.0% to $230,125, and condo buyers now have 7.5 months of supply to choose from. Rising mortgage rates shaped activity all month.
September 2026 delivered a split picture for the Myrtle Beach housing market. Single-family prices held their ground, while condos gave back value and sales slowed in both segments. According to CCAR MLS (September 2026), the regional single-family median sales price reached $370,000, up 1.4% from a year earlier. Over the same month, closed condo sales fell 12.4%. Borrowing costs set the backdrop. FRED data shows the 30-year fixed rate averaged 6.95% for the week of September 17, 2026, up from 6.26% in the same week of 2025. This report breaks down what changed, where it changed, and what the numbers mean for buyers and sellers across the Grand Strand.
Myrtle Beach Housing Market in September 2026: The Headline Numbers
CCAR’s regional figures cover all of Horry and Georgetown counties. That makes them the clearest single read on the Grand Strand as a whole.
According to CCAR MLS (September 2026), single-family closed sales dipped 3.3% to 1,012. New listings fell 8.6% to 1,202, and pending sales dropped 6.0% to 877. Fewer homes entering the market kept supply in check, even as sales cooled.
Here is how the two main property types compared.
September 2026 Grand Strand Market Snapshot: Single-Family vs. Condo
| Metric | Single-Family | YoY Change | Condo | YoY Change |
|---|---|---|---|---|
| Median Sales Price | $370,000 | +1.4% | $230,125 | -5.0% |
| Closed Sales | 1,012 | -3.3% | 368 | -12.4% |
| New Listings | 1,202 | -8.6% | 688 | -8.8% |
| Pending Sales | 877 | -6.0% | 420 | -6.3% |
| Days on Market | 118 | -6.3% | 137 | -3.5% |
| % of List Price Received | 97.3% | -0.2% | 95.9% | -0.1% |
| Inventory | 3,855 | -3.5% | 3,235 | 0.0% |
| Months Supply | 4.2 | -2.3% | 7.5 | -5.1% |
Source: CCAR MLS, Monthly Indicators (September 2026; data current as of October 10, 2026).
Year to date, single-family closings are up 0.8% to 8,494, according to the same report. The year-to-date median sits at $362,000, down 0.8%. September’s price gain came from one solid month, not a steady climb across 2026.
If you followed our August 2026 market report, the single-family median moved up from $367,000 in August to $370,000 in September.
Single-Family Homes and Condos Moved in Different Directions
Single-family homes showed steady pricing. Sellers received 97.3% of list price on average. Homes also sold faster, at 118 days on market versus 126 a year earlier.
Condos tell a different story. The median condo price fell to $230,125, and closings dropped to 368 units. With 7.5 months of supply, condo buyers have more choices and more room to negotiate than single-family buyers.
The 12-month view adds context. According to CCAR’s Housing Supply Overview (September 2026), pending sales from October 2025 through September 2026 rose 2.0% overall. Condos led that gain at 5.4%, so September’s condo dip followed a stronger stretch earlier in the year.
Price tier and home size also shaped results:
$1,000,001 and above: pending sales up 21.1% over 12 months, though September inventory in this tier also rose 18.5%
$250,001 to $350,000: September inventory down 9.8%, with just 3.6 months of single-family supply
4 or more bedrooms: pending sales up 5.7% over 12 months, the strongest bedroom category
For buyers seeking larger floor plans, that last point matters. Inventory of 4+ bedroom homes barely moved, rising just 0.3%, while demand in that category grew.
Grand Strand Neighborhood Snapshot
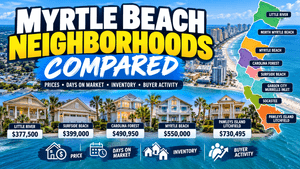
Regional numbers can hide big local differences. ZIP-level data from CCAR’s Local Market Update (September 2026) shows how much single-family results varied across Horry County and nearby areas.
Single-Family Results by Area, September 2026
| Area (ZIP) | Median Sales Price | Price YoY | Inventory YoY |
|---|---|---|---|
| Myrtle Beach (29572, 29577) | $488,000 | -7.0% | +17.1% |
| Carolina Forest (Area 10B) | $545,000 | +19.8% | -9.3% |
| North Myrtle Beach (29582) | $562,500 | -11.1% | -13.3% |
| Socastee (29588) | $369,000 | +3.9% | -19.3% |
| Surfside Beach (29575) | $375,000 | -10.7% | -2.1% |
| Little River (29566) | $365,100 | +5.8% | -7.2% |
| Conway (29526, 29527) | $310,000 | -3.1% | -7.4% |
| Loris / Longs (29568, 29569) | $322,500 | +4.0% | +13.4% |
Source: CCAR MLS, Local Market Update (September 2026; data current as of October 10, 2026).
Monthly ZIP-level medians can swing sharply because sale counts are small. Myrtle Beach ZIPs recorded just 49 single-family closings in September. The year-to-date median there, $522,500, offers a steadier read.
Two areas stand out. Single-family inventory in the Myrtle Beach ZIPs rose 17.1% to 343 homes, giving buyers more to compare. In Carolina Forest, inventory fell 9.3% and days on market dropped to 107.
Showing activity cooled as well. According to CCAR’s Showings Report (September 2026), the Myrtle Beach MLS area logged 5,761 showings, down 15.6% from a year earlier. Pawleys Island posted the highest buyer interest ratio in the region, at 2.9 showings per listing.
How Rising Rates Shaped September Activity
Mortgage rates climbed steadily through the month. FRED’s 30-year fixed series shows these weekly averages as of September 2026:
September 3: 6.71%
September 10: 6.76%
September 17: 6.95%
CCAR’s Monthly Indicators report (September 2026) notes the Federal Reserve raised its benchmark rate by a quarter point on September 16. That move brought the target range to 3.75% to 4%. The same report notes the 30-year rate moved above 7% in late September, citing Freddie Mac.
Higher rates show up in affordability. CCAR’s Housing Affordability Index for single-family homes fell to 76 in September, down 7.3% from 82 a year earlier. A lower index means a typical income stretches less far against the median home payment. Condos scored 122 on the same index, reflecting their lower price point.
National data offers a useful comparison. According to NAR, as reported in CCAR’s September 2026 release, U.S. existing-home supply reached 4.9 months heading into September. The Grand Strand’s single-family supply sat slightly tighter, at 4.2 months.
Rates and programs are subject to change; verify current details with your lender.
What the September Data Means for Buyers and Sellers
Current data points to a market that rewards preparation on both sides.
For buyers:
Condo shoppers have more inventory and more negotiating room, with sellers receiving 95.9% of list price on average
Single-family buyers in the $250,001 to $350,000 range face tighter supply, so pre-approval and a clear budget help
Rate movement changes monthly payments, so updated lender quotes matter more than usual
For sellers:
Single-family sellers still received 97.3% of list price, so accurate pricing remains the main lever
Fewer new listings means less direct competition in many single-family price ranges
Condo sellers face more competing listings and longer timelines, at 137 days on market
Local conditions vary widely by ZIP code and price tier. A regional headline rarely tells the full story for a specific property.
Whether September’s 7.5-month condo supply opens a door for you or rising rates have you rethinking a budget, the right next step depends on your price range and location. Our team tracks these Grand Strand numbers every month. We can walk you through what they mean for a specific home, lot, or custom build plan. If you’d like a clear read on your options, start the conversation with our team.
FAQ
Are home prices going up or down in Myrtle Beach right now?
It depends on property type. According to CCAR MLS (September 2026), the regional single-family median rose 1.4% to $370,000, while the condo median fell 5.0% to $230,125. Year to date, the single-family median sits at $362,000, down 0.8%, so the September gain reflects one month rather than a long trend. ZIP-level results vary even more. The Myrtle Beach ZIPs (29572, 29577) posted a $488,000 single-family median, down 7.0%, while Carolina Forest rose 19.8% to $545,000. Small monthly sale counts can exaggerate these swings.
Is the Myrtle Beach market favoring buyers or sellers in fall 2026?
The answer differs by segment. Single-family homes had 4.2 months of supply in September 2026, and sellers received 97.3% of list price on average, per CCAR MLS. Condos had 7.5 months of supply, with sellers receiving 95.9% of list price. That gives condo buyers more choice and negotiating room. Within single-family homes, the $250,001 to $350,000 range was tighter, at 3.6 months of supply. Your price range and location shape your leverage more than any regional headline.
How long does it take to sell a home in Myrtle Beach?
According to CCAR MLS (September 2026), single-family homes across the region averaged 118 days on market until sale, down from 126 a year earlier. Condos averaged 137 days, down from 142. Timelines vary by area. Carolina Forest single-family homes sold in 107 days, while the Myrtle Beach ZIPs averaged 129 days. Days on market measures the full listing period through closing, so it includes time under contract.
What are mortgage rates doing in fall 2026?
Rates rose through September. FRED’s 30-year fixed series shows weekly averages of 6.71% on September 3, 6.76% on September 10, and 6.95% on September 17, 2026. CCAR’s September report notes the rate moved above 7% later in the month, citing Freddie Mac, after the Federal Reserve raised its benchmark rate a quarter point on September 16. Rates and programs are subject to change, so verify current details with a licensed lender before making decisions.
Why did Myrtle Beach condo prices drop in September 2026?
CCAR data shows what changed, not why. The regional condo median fell 5.0% to $230,125, closings dropped 12.4%, and inventory held flat at 3,235 units. In the Myrtle Beach ZIPs, the condo median fell 25.4% to $177,450 on 102 closings. Rising rates during the month coincided with the slowdown. Over a longer window, condo pending sales rose 5.4% from October 2025 through September 2026, so the September dip followed a stronger stretch.
Which Grand Strand areas saw the biggest price changes in September 2026?
According to CCAR’s Local Market Update (September 2026), Carolina Forest posted the largest single-family gain, up 19.8% to $545,000. Little River rose 5.8% to $365,100. North Myrtle Beach saw the largest decline, down 11.1% to $562,500, followed by Surfside Beach at down 10.7%. These are monthly medians based on small sale counts, so year-to-date figures often give a more stable picture of local pricing.
Sources
Coastal Carolinas Association of REALTORS® (Monthly Indicators, Housing Supply Overview, Local Market Update, Showings Report — September 2026): https://www.ccarsc.org/pages/marketstats
FRED Economic Data (30-Year Fixed Rate Mortgage Average, MORTGAGE30US): https://fred.stlouisfed.org/
National Association of REALTORS®: https://www.nar.realtor/
August 2026 Myrtle Beach Housing Market Report: https://www.carolinacraftedhomes.com/blog/myrtle-beach-housing-market-august-2026
Buyer Leverage in the 2026 Myrtle Beach Market: https://www.carolinacraftedhomes.com/blog/myrtle-beach-housing-market-buyer-leverage-2026
Myrtle Beach Mid-Year 2026 Housing Market Report: https://www.carolinacraftedhomes.com/blog/myrtle-beach-housing-market-mid-year-report-2026
Myrtle Beach Median Home Price in 2026: https://www.carolinacraftedhomes.com/blog/myrtle-beach-sc-median-home-price-2026
Days on Market in Myrtle Beach: https://www.carolinacraftedhomes.com/blog/days-on-market-myrtle-beach-sc-2026
Browse New Listings: https://www.carolinacraftedhomes.com/new-listings